
ReadMood
Social Wearable & App Design for Stress Management

Individual Work, Duration: 4 Months
Project Overview
ReadMood is a social wearable that allows users to detect the stress level of themselves and others. It tracks the mood of the user throughout the day and recommends actions for them in order to regulate their emotional state. It also helps users to build and evaluate relationships with others in real-time.

By examining one’s emotional fluctuations throughout the day via the detection of subtle biometric changes on their skin, users can be more mindful of their emotional states over time. In addition, the mobile app is designed to allow users to share their “feelings” with others simply by exchanging their emotional data to their loved ones.

The Challenge
1. Stress cannot be monitored directly given to the complexity of the data set. How to track it?
2. Raw data is hard to read for common users.
3. How to exchange stress data between people without invasion of privacy?
The Solution
Hardware
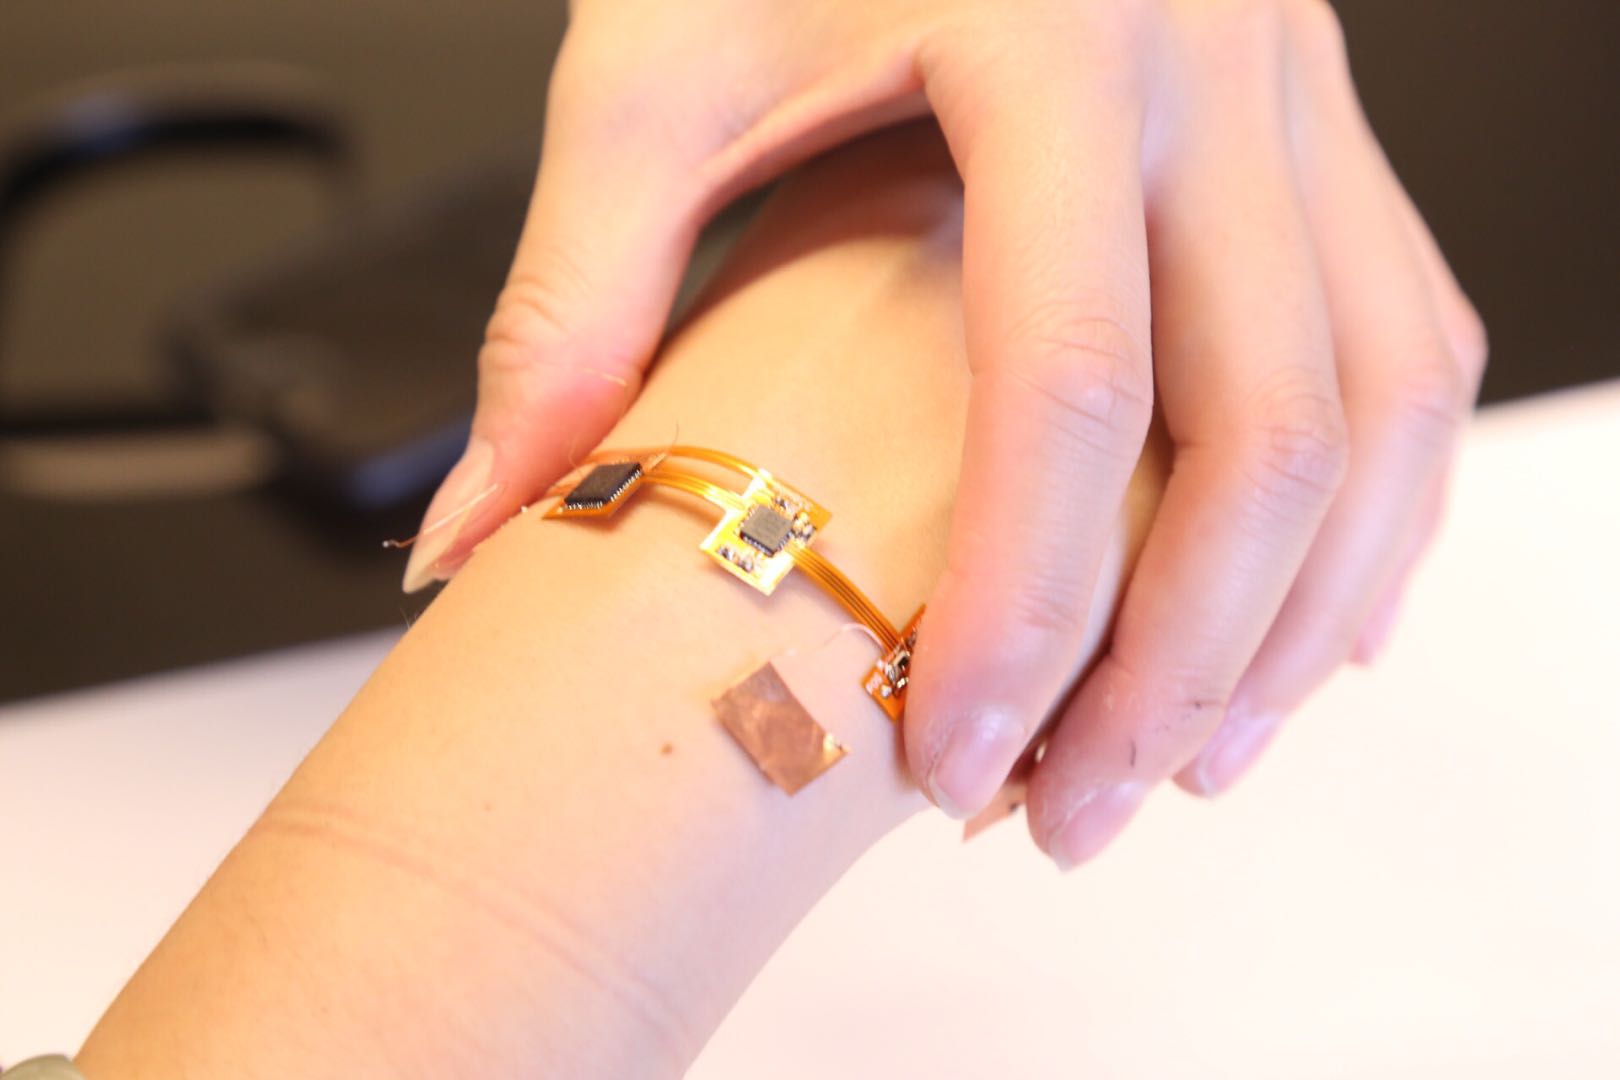
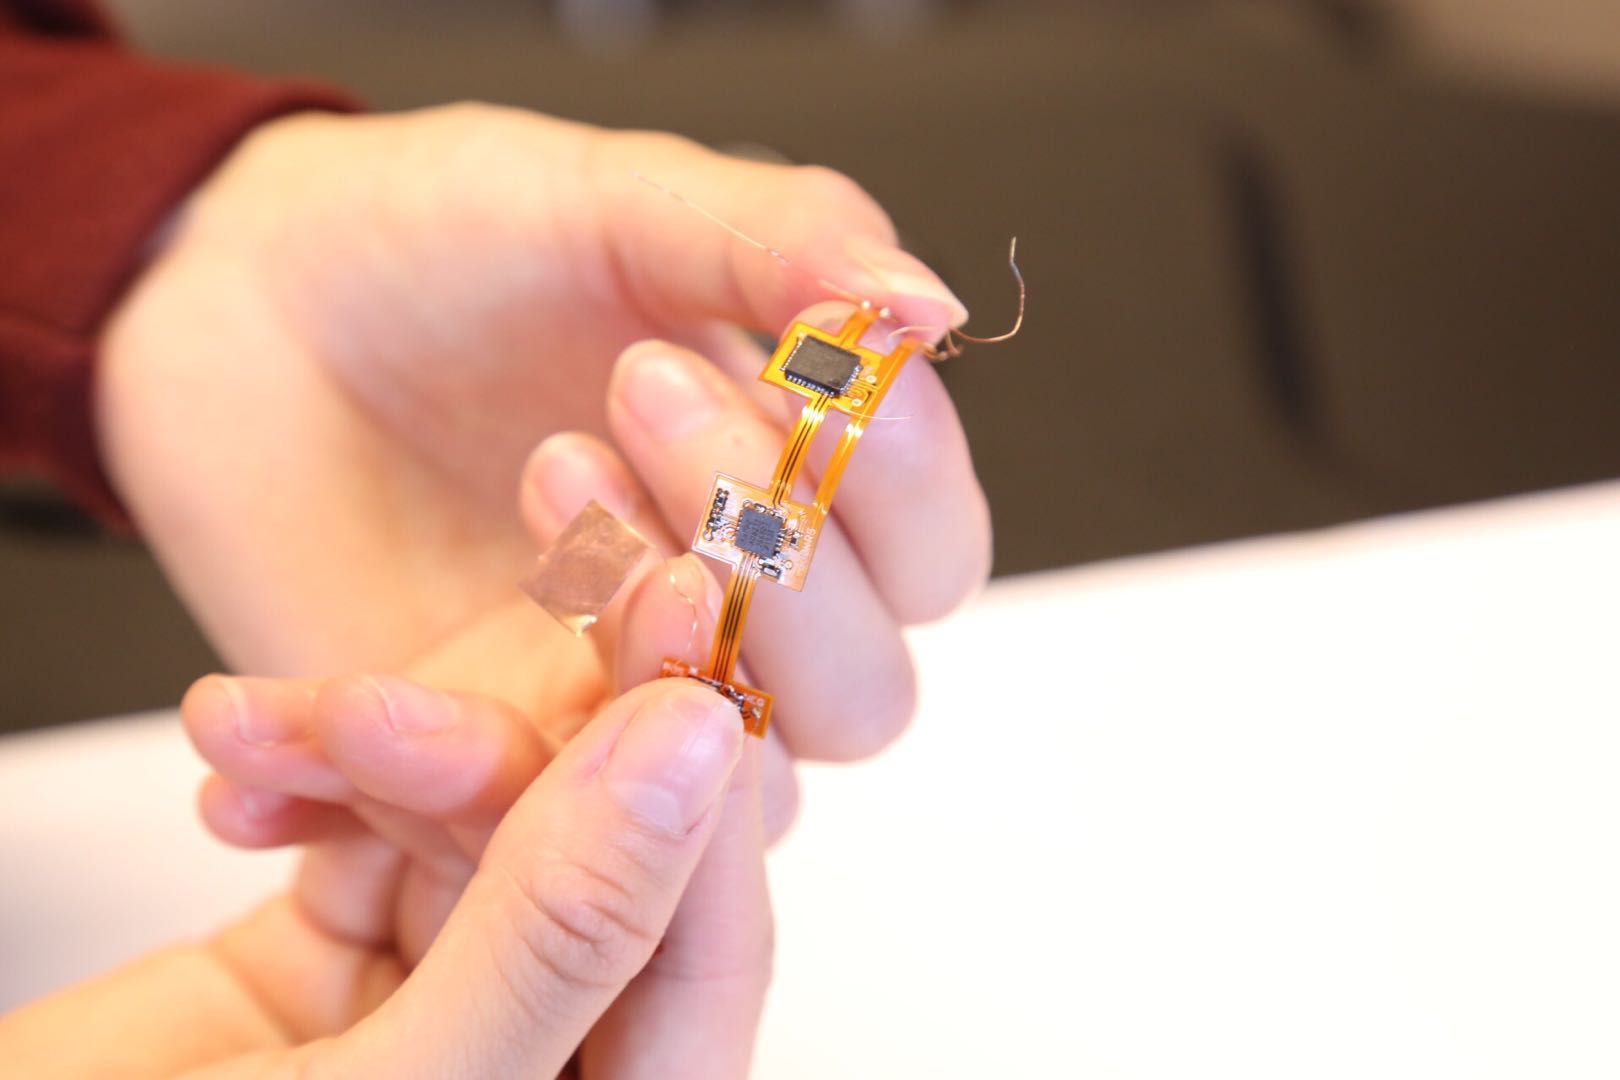
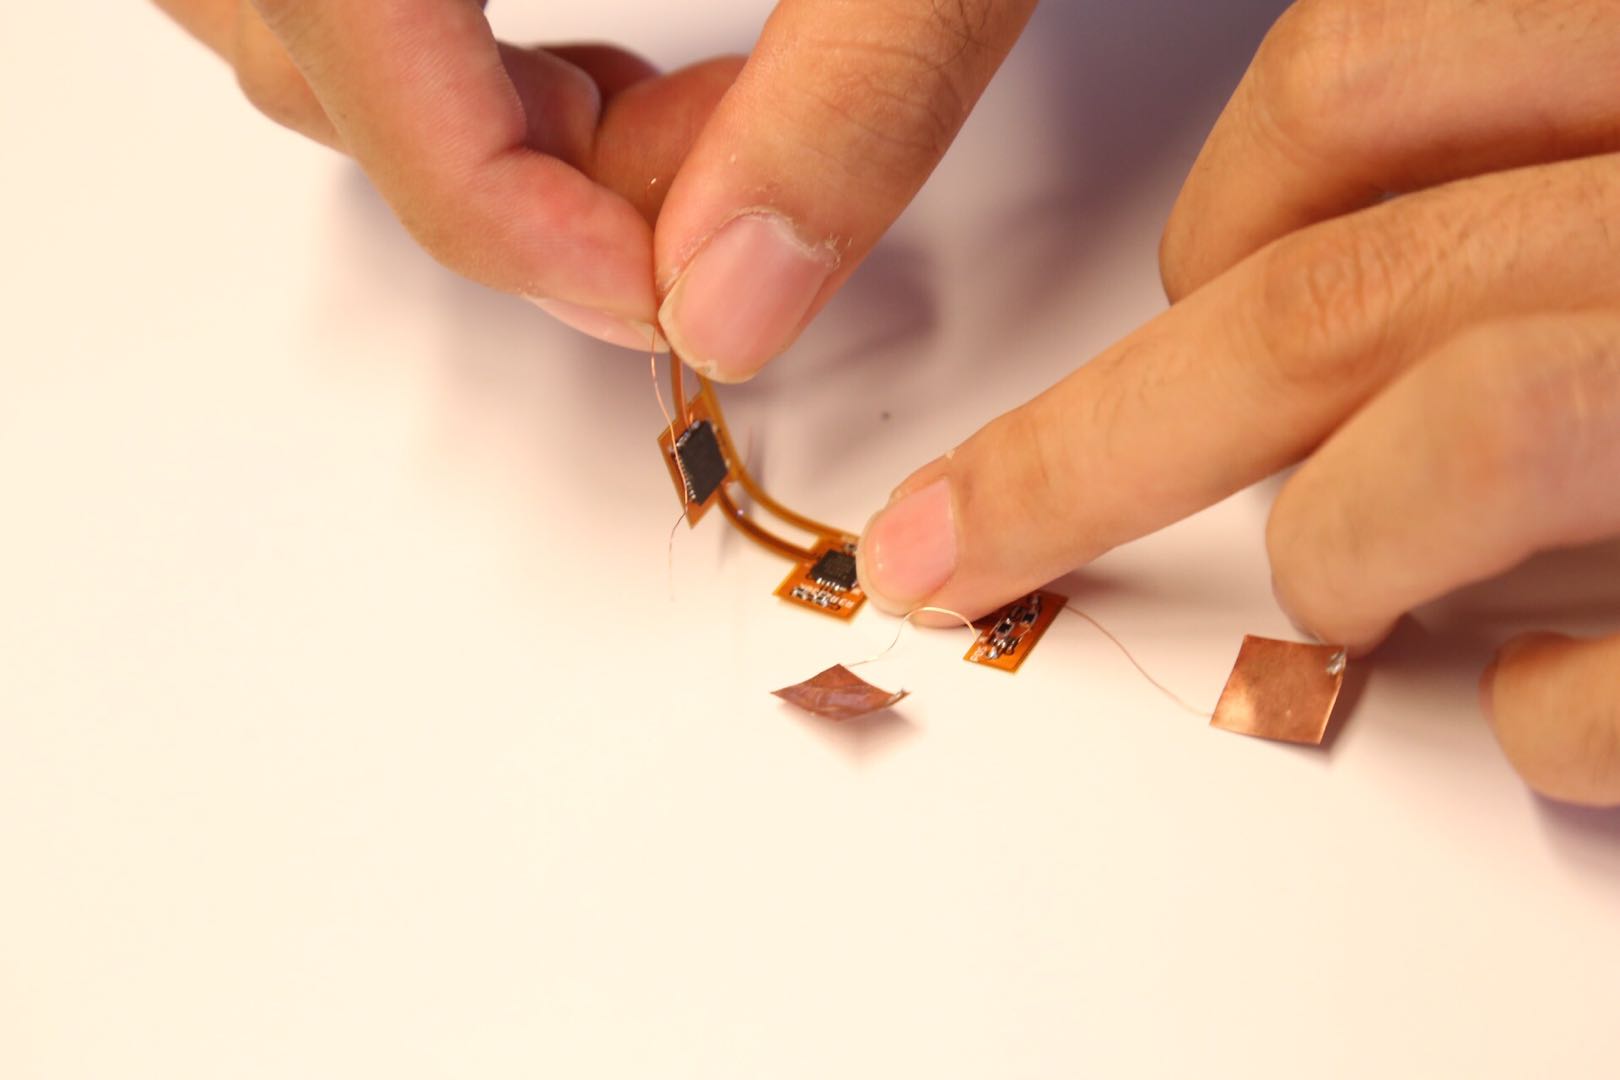
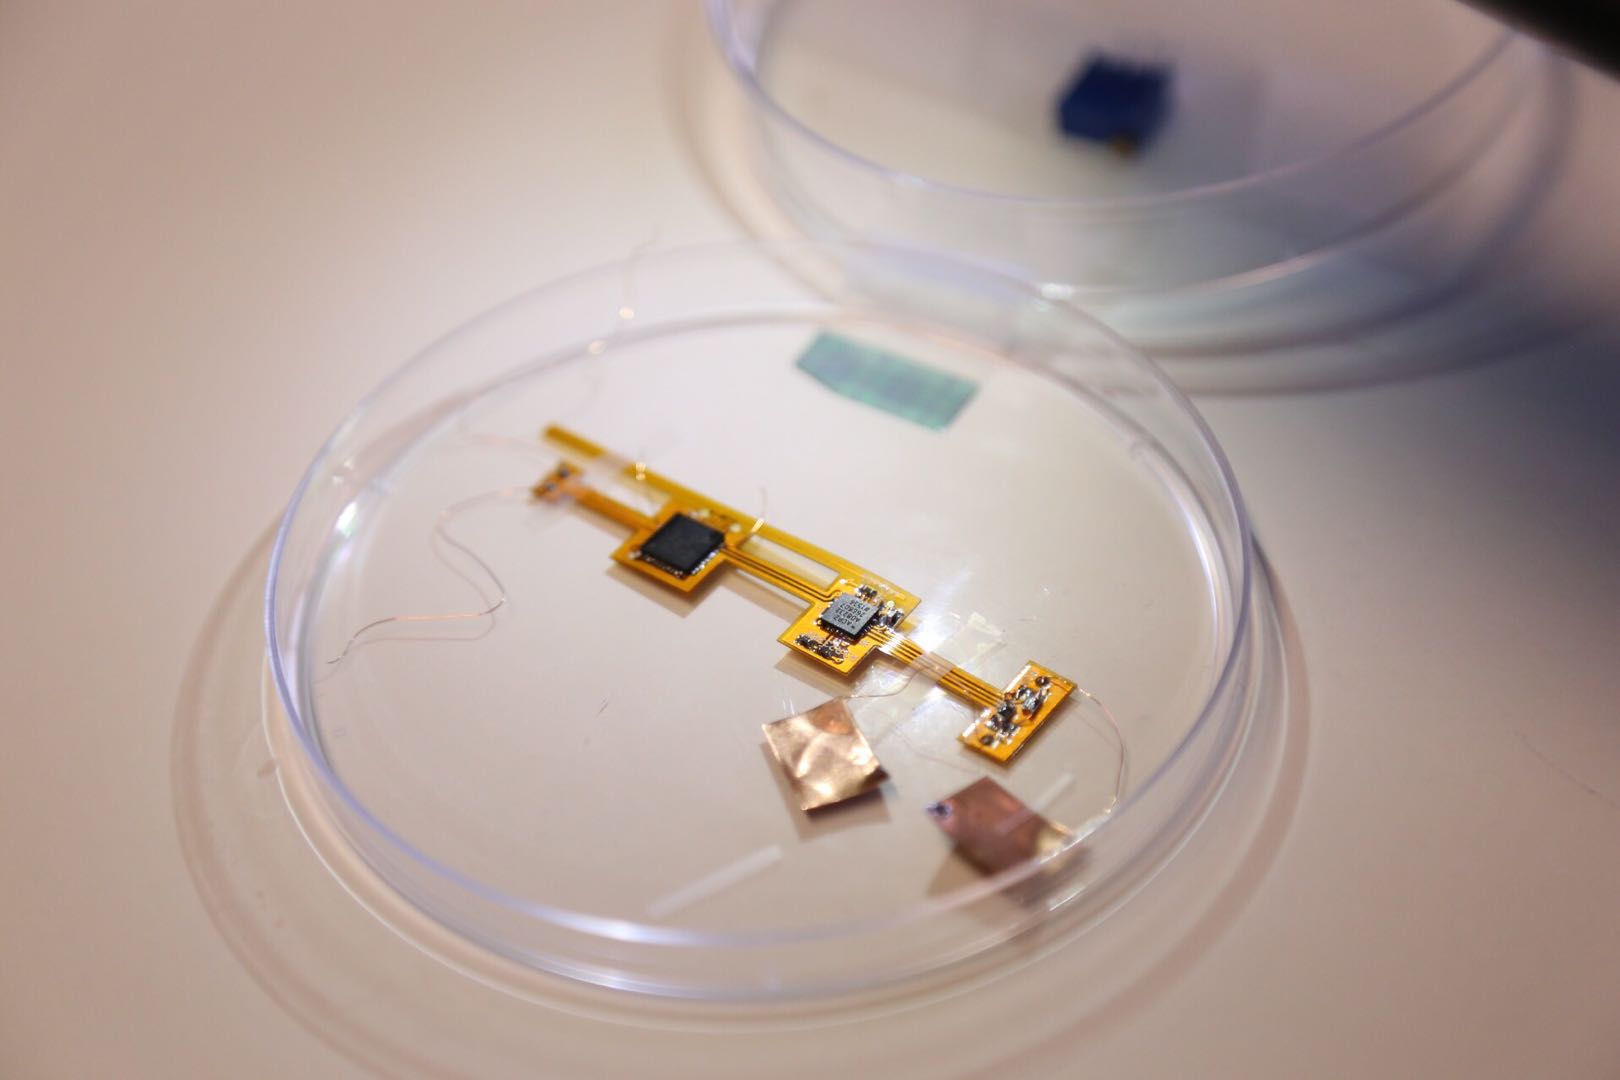
To combat the challenge, I present ReadMood, a social wearable that detects the subtle biometric changes in skin with several sensors: GSR, Heartrate, BVP and Accelerator. With the use of Bluetooth, users can easily exchange data with others.
App
An app is designed to visualize stress data through Machine Learning process. It is featured with a "Three - Level Relationship" function, a user-friendly interface to illustrate stress trends and patterns as well as some stress soothing programs such as music, yoga and meditation.
Most importantly, it allows users to check the stress level of their loved ones and show empathy and support.
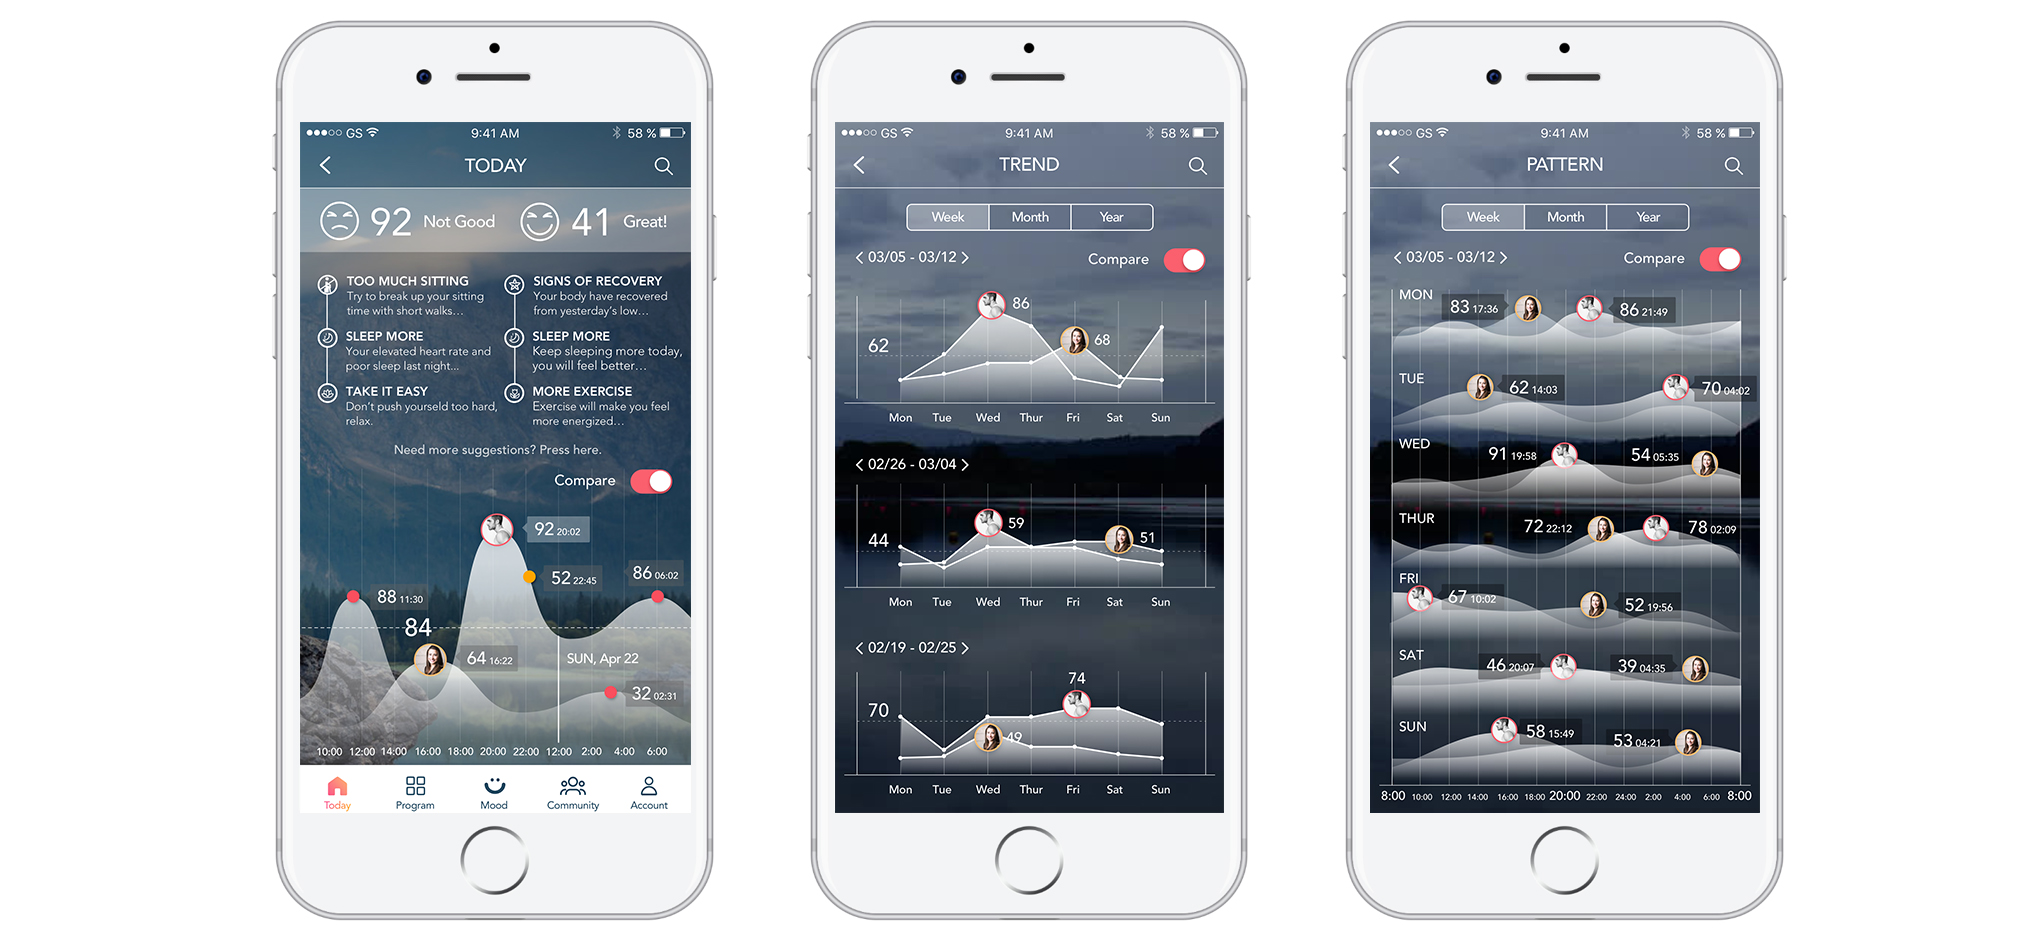
Check Your Stress Data

Check the Stress Data of Your Loved Ones and Compare
Why I did this?
I studied some existing stress-monitoring wearables and apps and found that most of them are only using raw data and real-time data without analysis of the patterns and trends of emotions. Besides, all of them focus on personal mental health care with no one dealing with interpersonal relationships.

INITIAL RESEARCH
What is Stress?
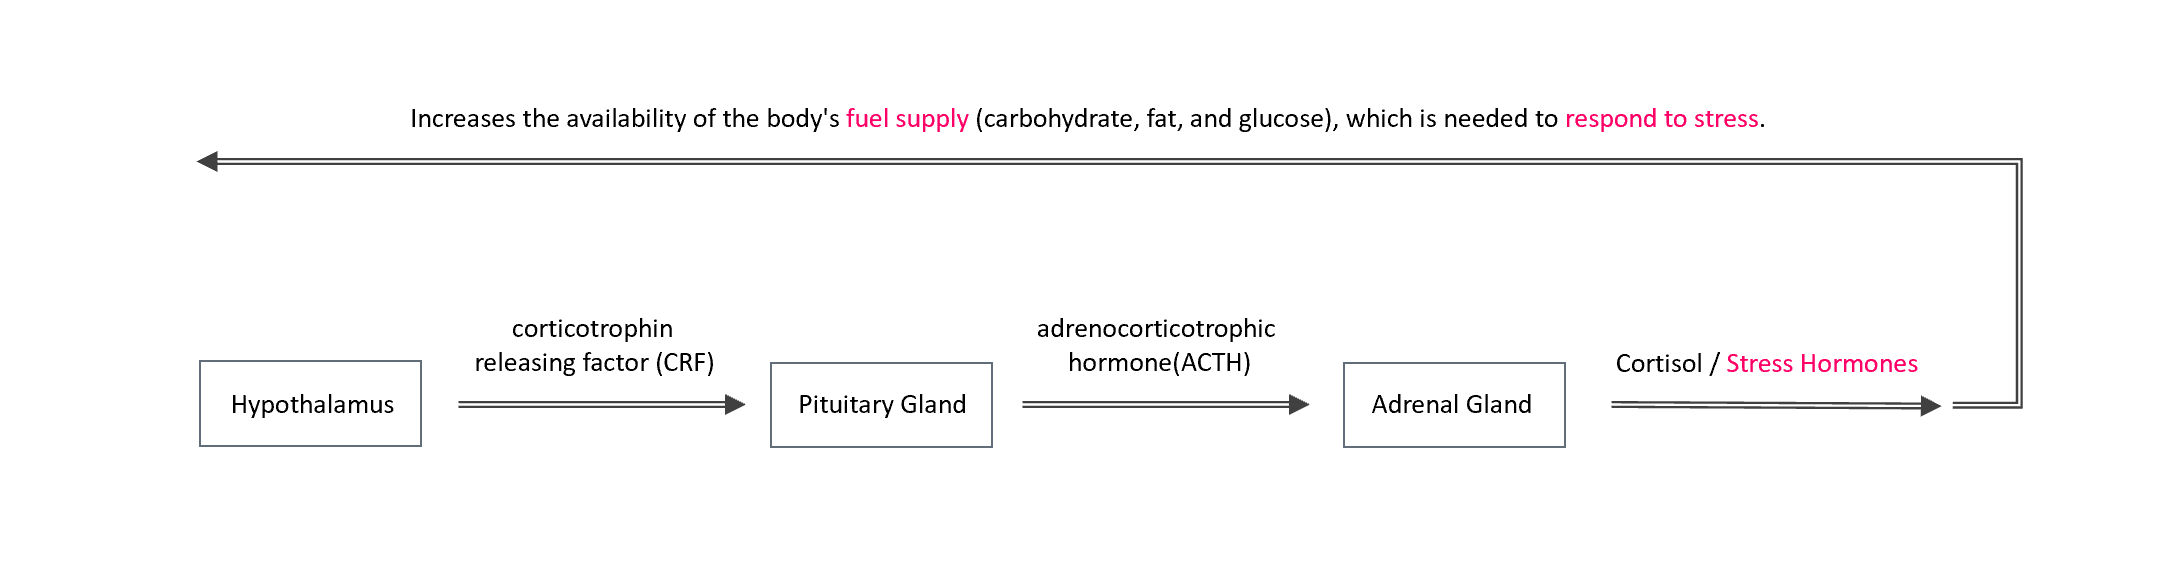
Stress is a physiological response to the mental, emotional, or physical challenges that we encounter. When you sense danger, the body's defenses kick into high gear in a rapid, automatic process known as the "fight-or-flight" reaction or the "stress response". It is triggered by the release of hormones that prepare your body to either stay and deal with or to run away to safety.
Stress in Daily Life

Statistics
According to the Anxiety and Depression Association of America, “anxiety disorders are one of the most common mental health problems on college campuses. It’s also important to note that anxiety often coexists with depression: according to depression statistics from the CDC.

Symptoms
There are four major symptoms: Physical, Behavioral, Cognitive and Emotional.

USER RESEARCH
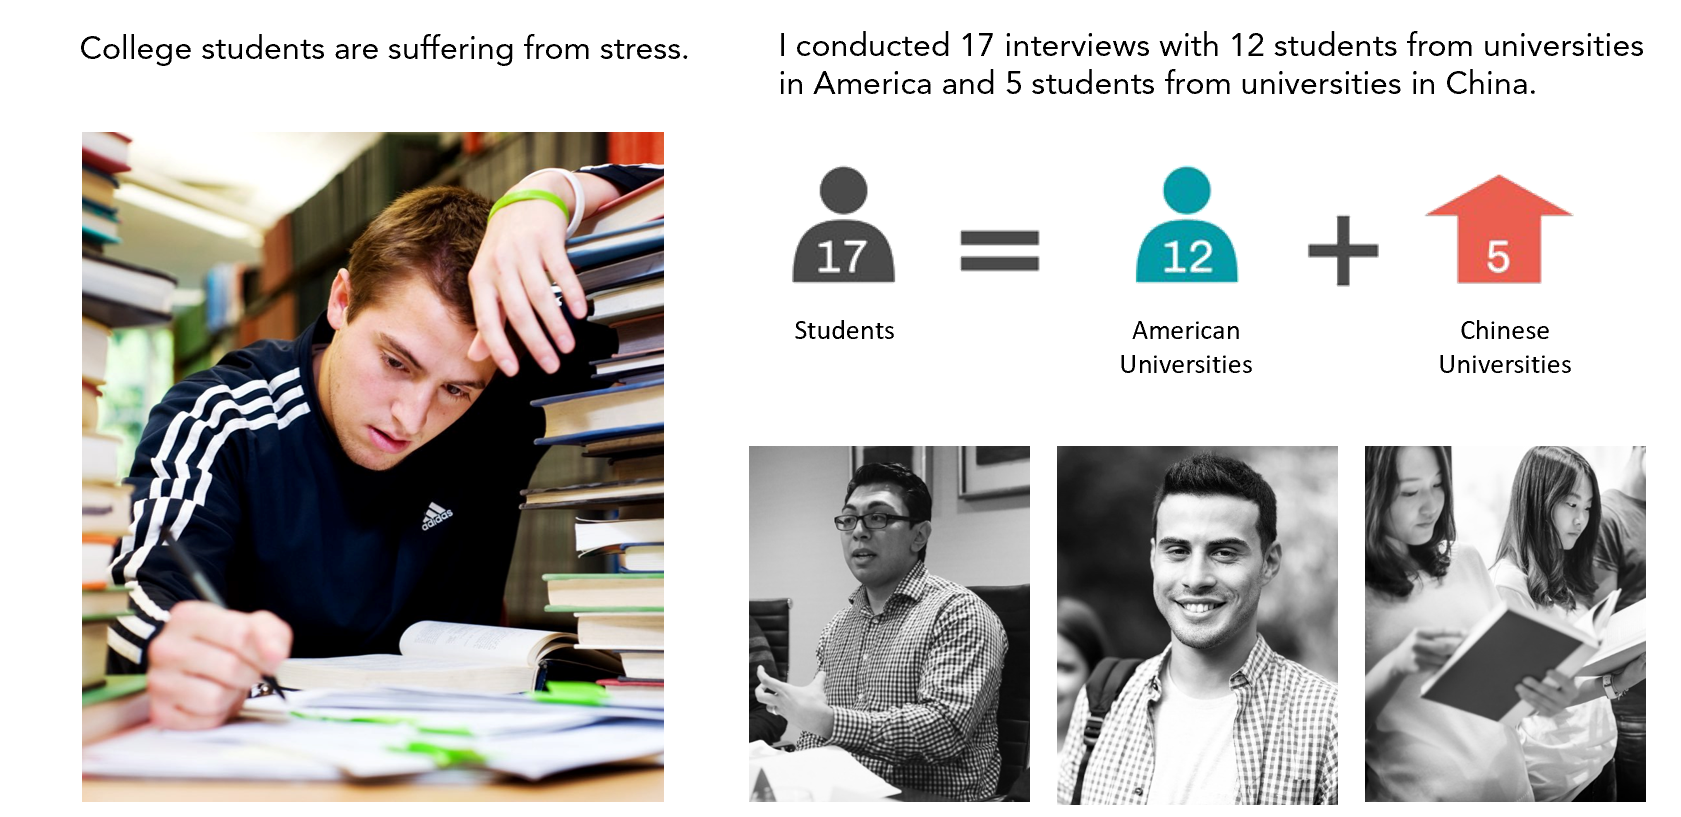
Target Group: College Students
QUESTIONAIRE

KEY FINDINGS
1. Nearly 80% of college students are suffering from high-level stress.
I'm surprised with this number and feel hard to imagine that such a big group of college students are suffering from stress, or even depression. Among them, 38% of students say that stress has a strong impact on their mental health and 40% of students say that stress has a strong impact on their physical health. Students all respond to stressors in different ways and not all students will find the same situation to be stressful.

2. However, 60% of them don't have enough knowledge of stress management.
Students are attempting to balance a heavy academic load while trying to connect socially with an entirely new group of individuals as well as being in charge of their own care. The availability of alcohol, drugs and sexual freedom is often a struggle for students too. For students who have previous mental health concerns, college can be the first time they need to manage their own medication schedules as well. Being patient with yourself, practicing good self-care, and seeking additional support when necessary will go a long way toward reducing the stress of many transitions.

3. Top Three causes for stress are deadlines, relationships and future.
Among all other causes including Uncertainties (10%), Challenges (23%), Disagreement (33%), Socializing (46%), Financial Security (25%), Responsibilities (35%), Deadlines, relationships and future are the top three causes, about 71%, 53% and 51% respectively.

Interview Insights
During the 17 interviews, it is interesting to note that...
1. 9 of them own a smart wearable device and 4 of them would like to buy one in the near future.
Among the 9 interviewees who have smartwatches already,, 6 use Apple watch, 2 use Fitbit and 1 use a small brand smartwatch. 5 of them are male and 4 are female. Several interviewees mentioned that they have never used a smartwatch but are very willing to try in the future.
2. The major two things they do on smart watch are tracking activities and socializing.
The tracking of one’s own physical activity with wearable devices is a way of monitoring and motivating oneself to remain healthy. Smartwatch can track your workouts, give you active training tips, they can also easily measure heart rate, sleep patterns, blood alcohol level, etc. Men, younger individuals and those who frequently exercise have a higher likelihood of using wearable devices for physical activity tracking. Besides, socializing is another major activity they do on smart watches. They check emails, reply to messages, make phone calls without the effort of taking the phone out.

With these initial research insights, I further defined the design goal:
1. How might we design a wearable that tracks the real-time stress data and provides suggestions?
2. How might we allow users to check the stress level of their loved ones to show more empathy and nurture better relationships?
EXPERIMENT
How to detect & measure stress data?
There are four main methods to detect and measure stress: Survey and Interview, Hormone Injection, Behaviors Observation and Physiological Sensors. I chose using Physiological Sensors to detect stress data in my project since it's noninvasive and caring.

Four Main Physiological Sensors
EDA sensor detects electrodermal activity refers to electrical changes, measured at the surface of the skin, that arise when people experience emotional activation.
Heart Rate sensor detects peaks (beats) from the PPG (Photoplethysmography) and computing the lengths of the intervals between adjacent beats.
Body Temperature sensor detects the fluctuation of the temperature of human body.
Accelerator sensor detects movement in the X, Y and Z directions / Capture motion-based activity.

Tracking Stress over time
Physiological data including Electrodermal Activity (EDA), Heartrate, accelerometers, Blood Volume Pulse (BVP) and temperature can be detected through the automatic stress-monitoring system. I conducted several experiments to detect the data of myself.

Experiment with Heartbeat Sensor


Experiment with E4 Band
E4 wristband is a wearable research device that offers real-time physiological data acquisition and software for in-depth analysis and visualization.

View sensor data in real time with a temporal resolution of 0.2 seconds with the connected device. The data will automatically be uploaded to E4 connect, the secure cloud platform, after the session ends. Ideal for laboratory settings and live events where you want to showcase the data.

Problems
Raw data is hard to read for common users.
The biological data has a periodic pattern and trend, but it’s not shown in the existing visualization.
Stress cannot be monitored directly, other information is needed to get a more comprehensive picture.
The data is disturbed by external factors.
Solution - Physiological Data + Machine Learning + Context
First, the data was stored locally on the Empatica device, then transferred to a computer where the rest of the processing was performed. The context information is required to distinguish between psychological stress in real life and the many situations which induce a similar physiological arousal (e.g., exercise, eating, hot weather, etc.).

Machine Learning for Stress Detector
The method contains six phases: segmentation, filtering, feature extraction, feature selection, model learning and evaluation of the models.
The segmentation refers to the segmentation of the data into windows used for extracting the features. Then numerical features are extracted from each data window using statistical functions, regression analysis and frequency and time analysis, depending on the type of the signal. The idea of the feature-selection method is to remove correlated and ‘‘non-informative” features. The evaluation metrics used for comparing the models are: accuracy (1), precision (2), recall (3) and F1 score (4). The accuracy provides information about the percentage of instances that were classified correctly by the model. The precision and the recall are metrics that provide label-specific information. The precision provides information about how many instances the model classified correctly when predicting the label X (where X can be ‘‘no stress”, ‘‘low stress”, and ‘‘high stress”).

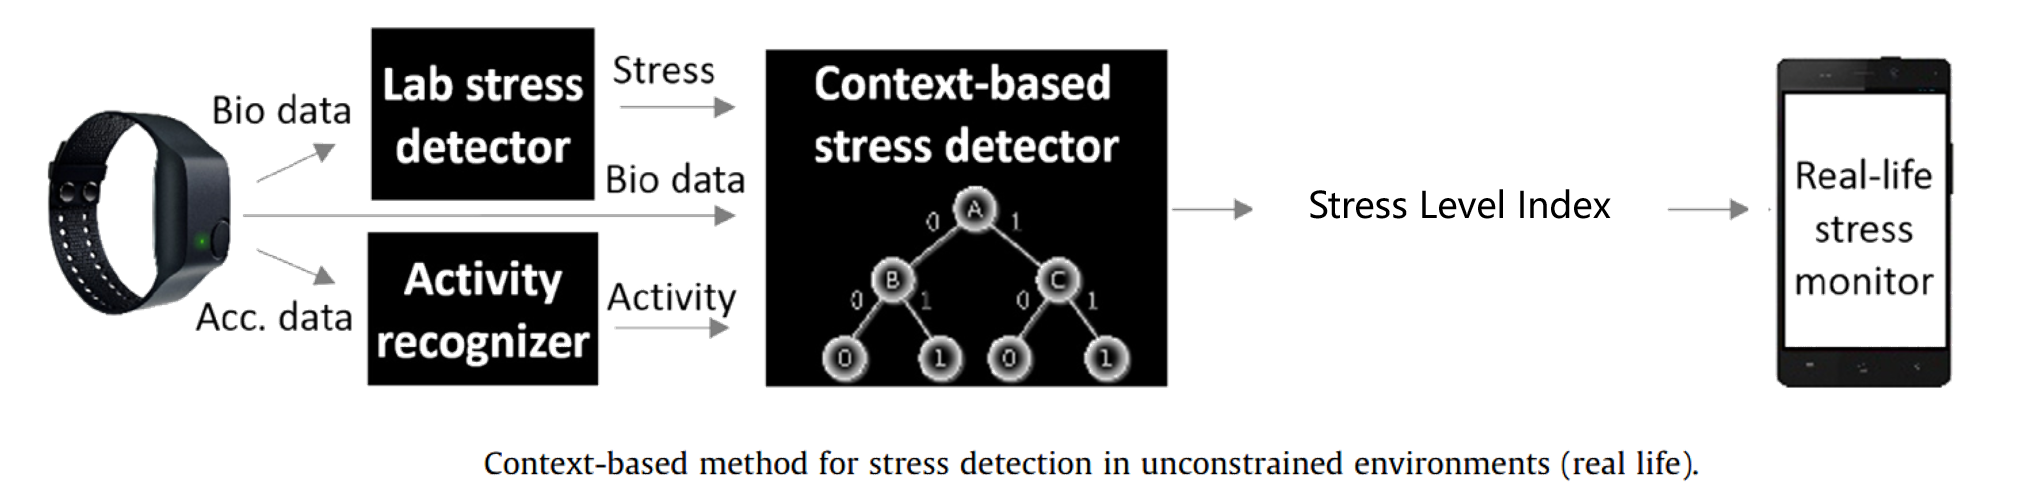
Context-Based Method for Stress Detection
Then the context-based stress detector was developed to distinguish between psychological stress in real life and many situations which induce a similar physiological arousal (e.g., exercise, eating, hot weather, etc.). It classifies every 10 min as stressful or nonstressful. The Stress Level Index is the outcome from Machine Learning process and will be used in the app to estimate the stress level of the user.
IDEATION
After the experiment, I understand how to detect stress data and how to visualize it throught Machine Learning. So let's get back to the two insights mentioned above.
1. How might we design a wearable that tracks the real-time stress data and provides suggestions?
2. How might we allow users to check the stress level of their loved ones to show more empathy and nurture better relationships?
Based on these two insights, I did user flow to better understand the "Golden Path".
USER FLOW


USER JOURNEY & LOW-FIDELITY PROTOTYPE


WIREFRAMES (MID-FIDELITY PROTOTYPE)

INFORMATION ARCHITECTURE

FINAL DESIGN


Questions


Onboarding Prototype

Personal & Interpersonal


“Self” Prototype

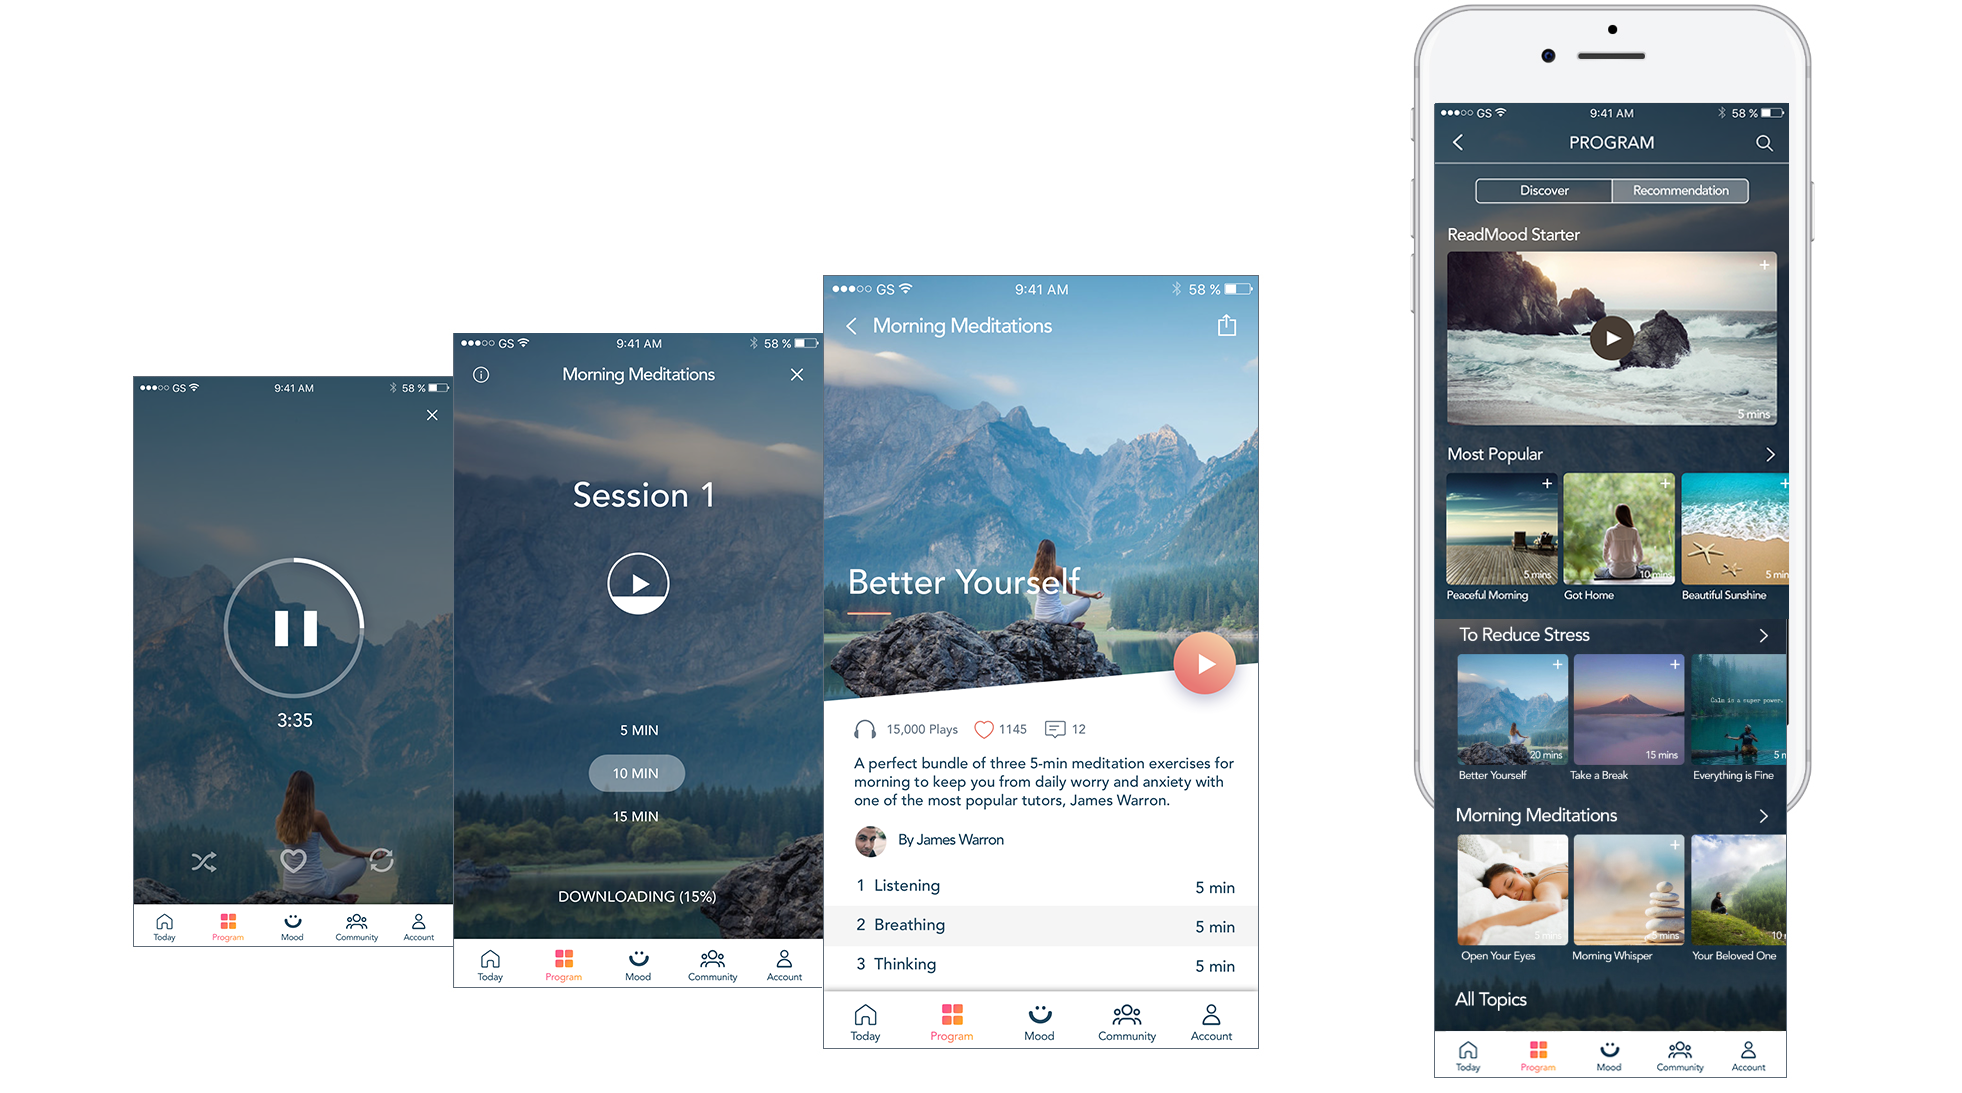
Programs
Mood

Community

Program / Mood / Community Prototype

"Loved Ones" Prototype

By changing the toggle button, the user can easily check the stress data of himself and his beloved ones.


Visual Design Guidelines
Iconography Color Font

SUMMARY

FUTURE WORK
•Hardware development
•Detailed product design
•Experiment with different groups of people